The challenge
DSPs lacked any high-level tracking tools to monitor cash flow or project earnings—they were forced to manually copy-paste data into fragile, self-built spreadsheets to survive.
DSPs operate on razor-thin margins. To perform a basic financial review, partners had to manually gather data from five separate, non-integrated sources (Work Summary Tool, bank statements, credit cards, payroll systems, and QuickBooks). Because the legacy Payments portal was a flat, un-sortable PDF list, accountants and bookkeepers spent hours manually rekeying line items. The design team’s initial approach was simply to polish the list view. My task was to push past this incremental design and establish a strategic, multi-year dashboard vision that truly supported long-term business health and de-risked partner turnover.
The Action
Figma-Based Co-Creation
To build an undeniable vision that would secure long-term engineering funding, I partnered with a dedicated designer to run rapid, collaborative co-creation sprints. I developed interactive, Figma-based workshop tools that allowed DSPs to actively “build” their ideal financial dashboard in real time during our sessions. Rather than asking them to react to static mocks, this participatory design approach allowed us to capture both quantitative and qualitative preferences on layout, widget placement, and data prioritization.
Based on this co-creation data, we designed and launched a modernized Payments Dashboard with several key innovations:
- “Pending Actions” Hub: Co-located weekly and monthly invoices with prominent, down-to-the-minute countdown timers so partners instantly knew what required review and how long they had to dispute.
- Interactive Financial Trends: Visualized total route counts and package volumes over time—the direct inputs to their revenue—enabling partners to quickly spot declines in volume and adjust expenses.
- One-Click Bulk Downloads: Implemented simple, one-click bulk exports supporting PDF, Excel, and CSV formats, allowing accountants to easily ingest accurate Amazon data into QuickBooks without manual transcription.
- Mobile-First Responsiveness: Designed the entire experience around a highly responsive, mobile-first grid so busy dispatchers could review cash flow on-the-go from the station pad or field.
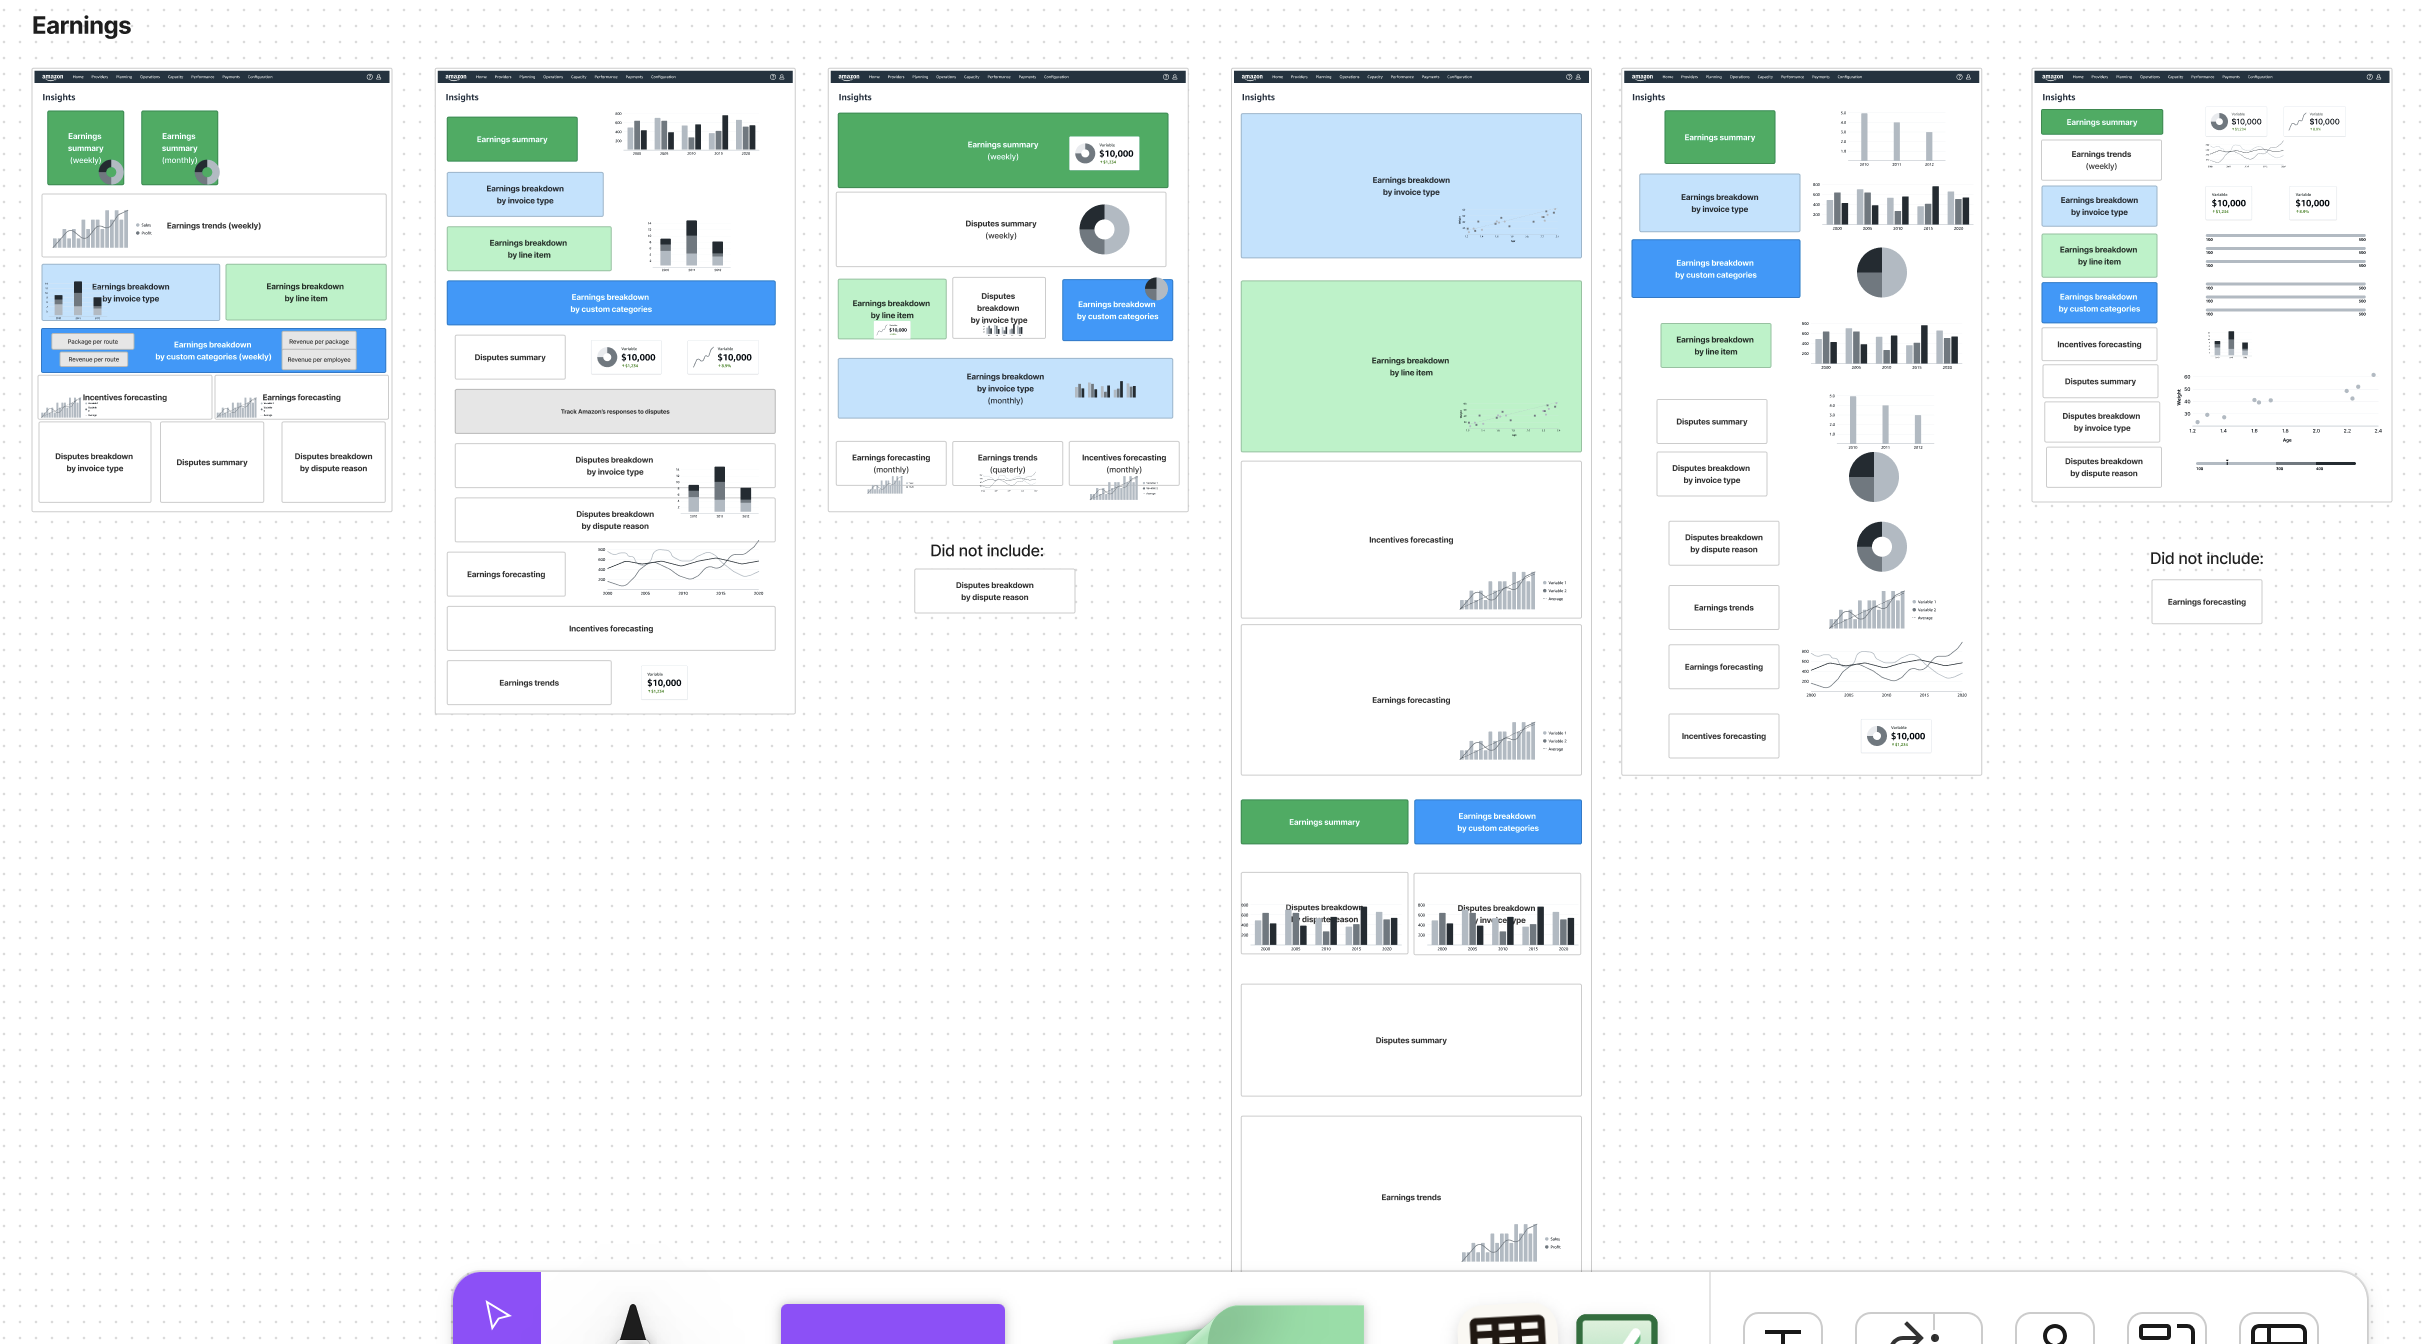
DSP’s Ideal Payment Dashboards
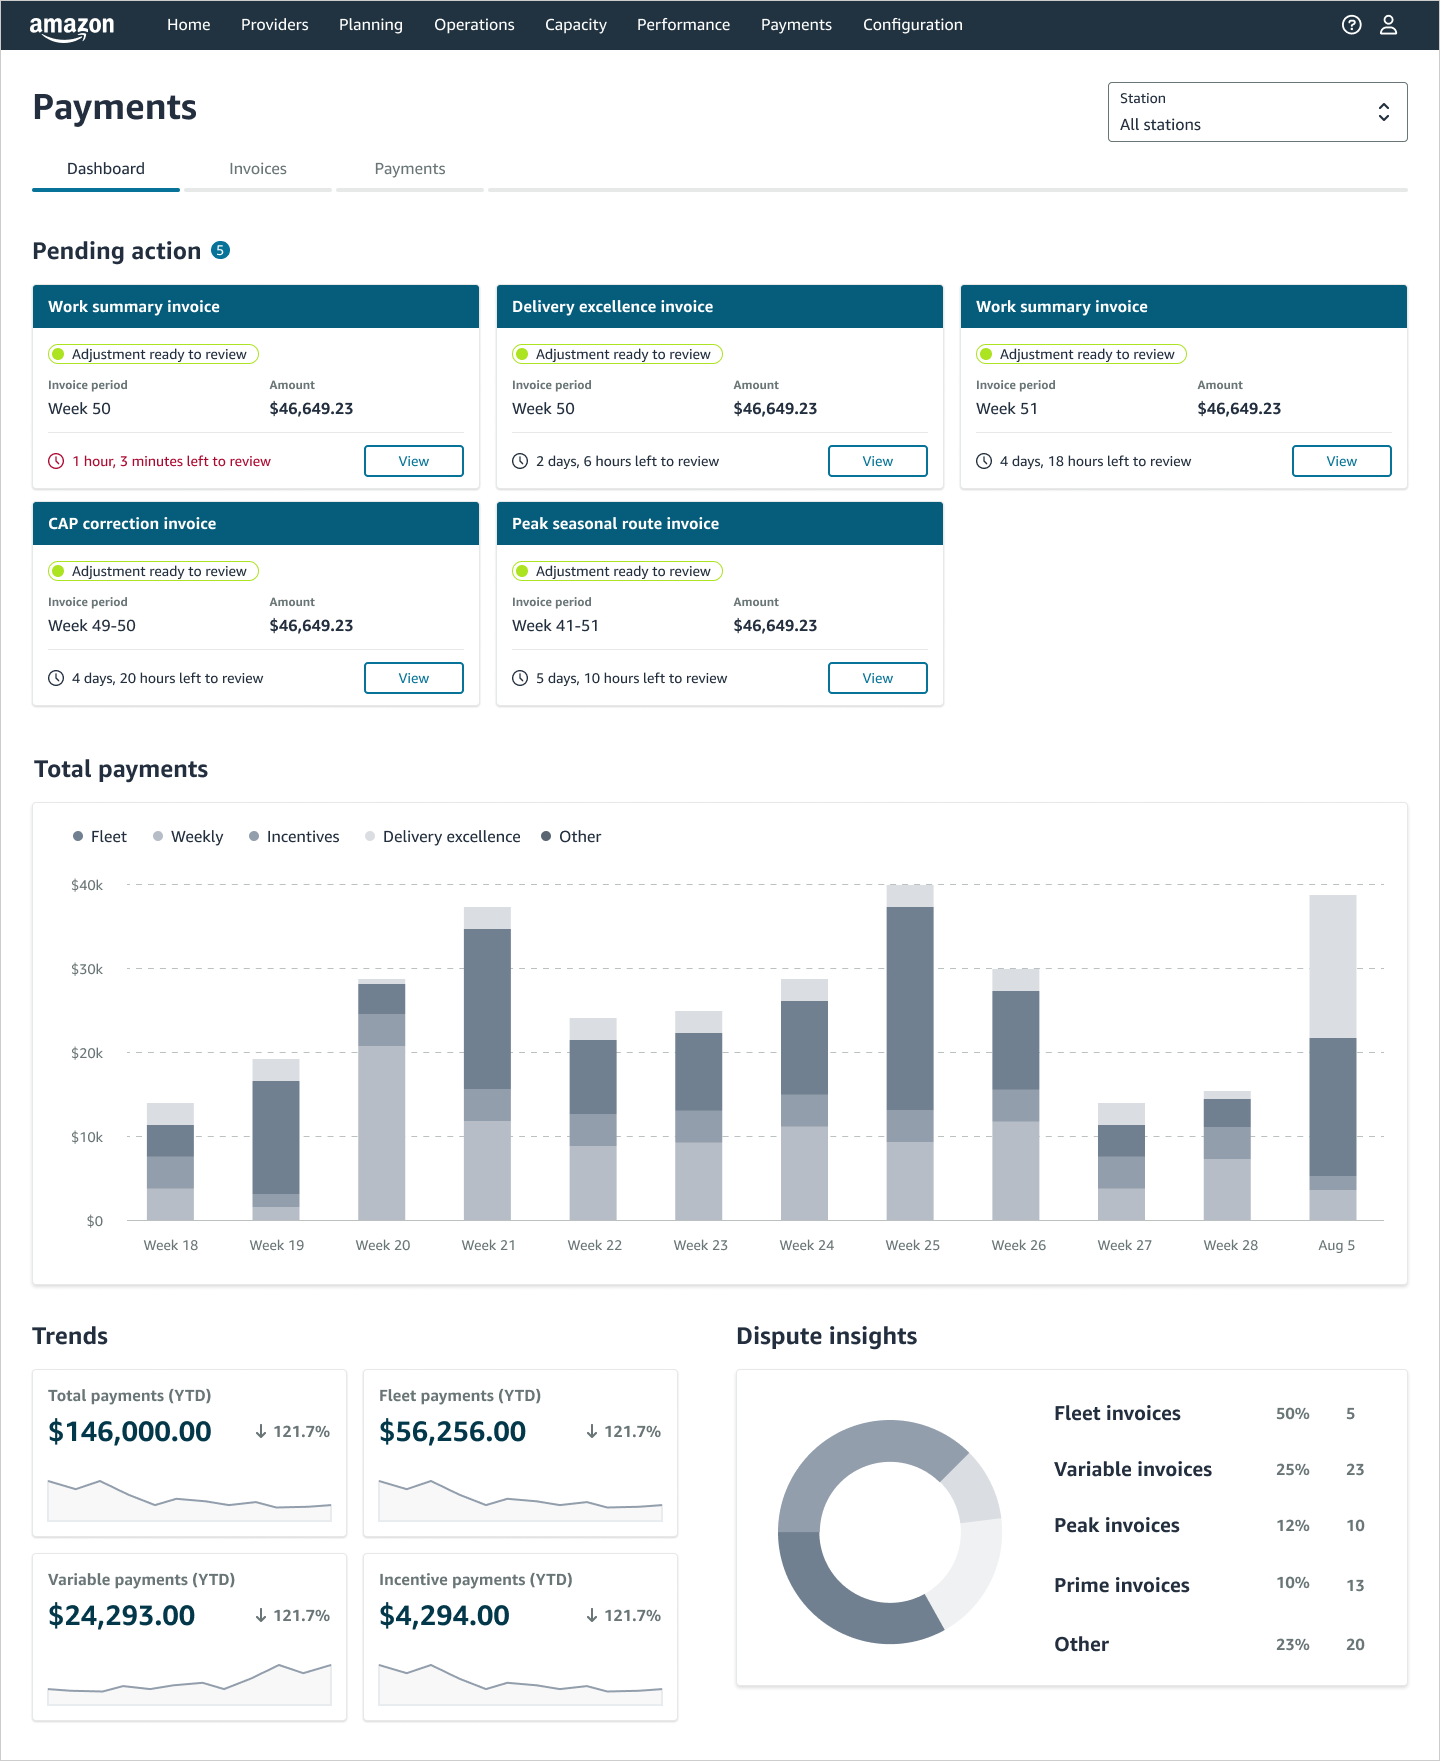
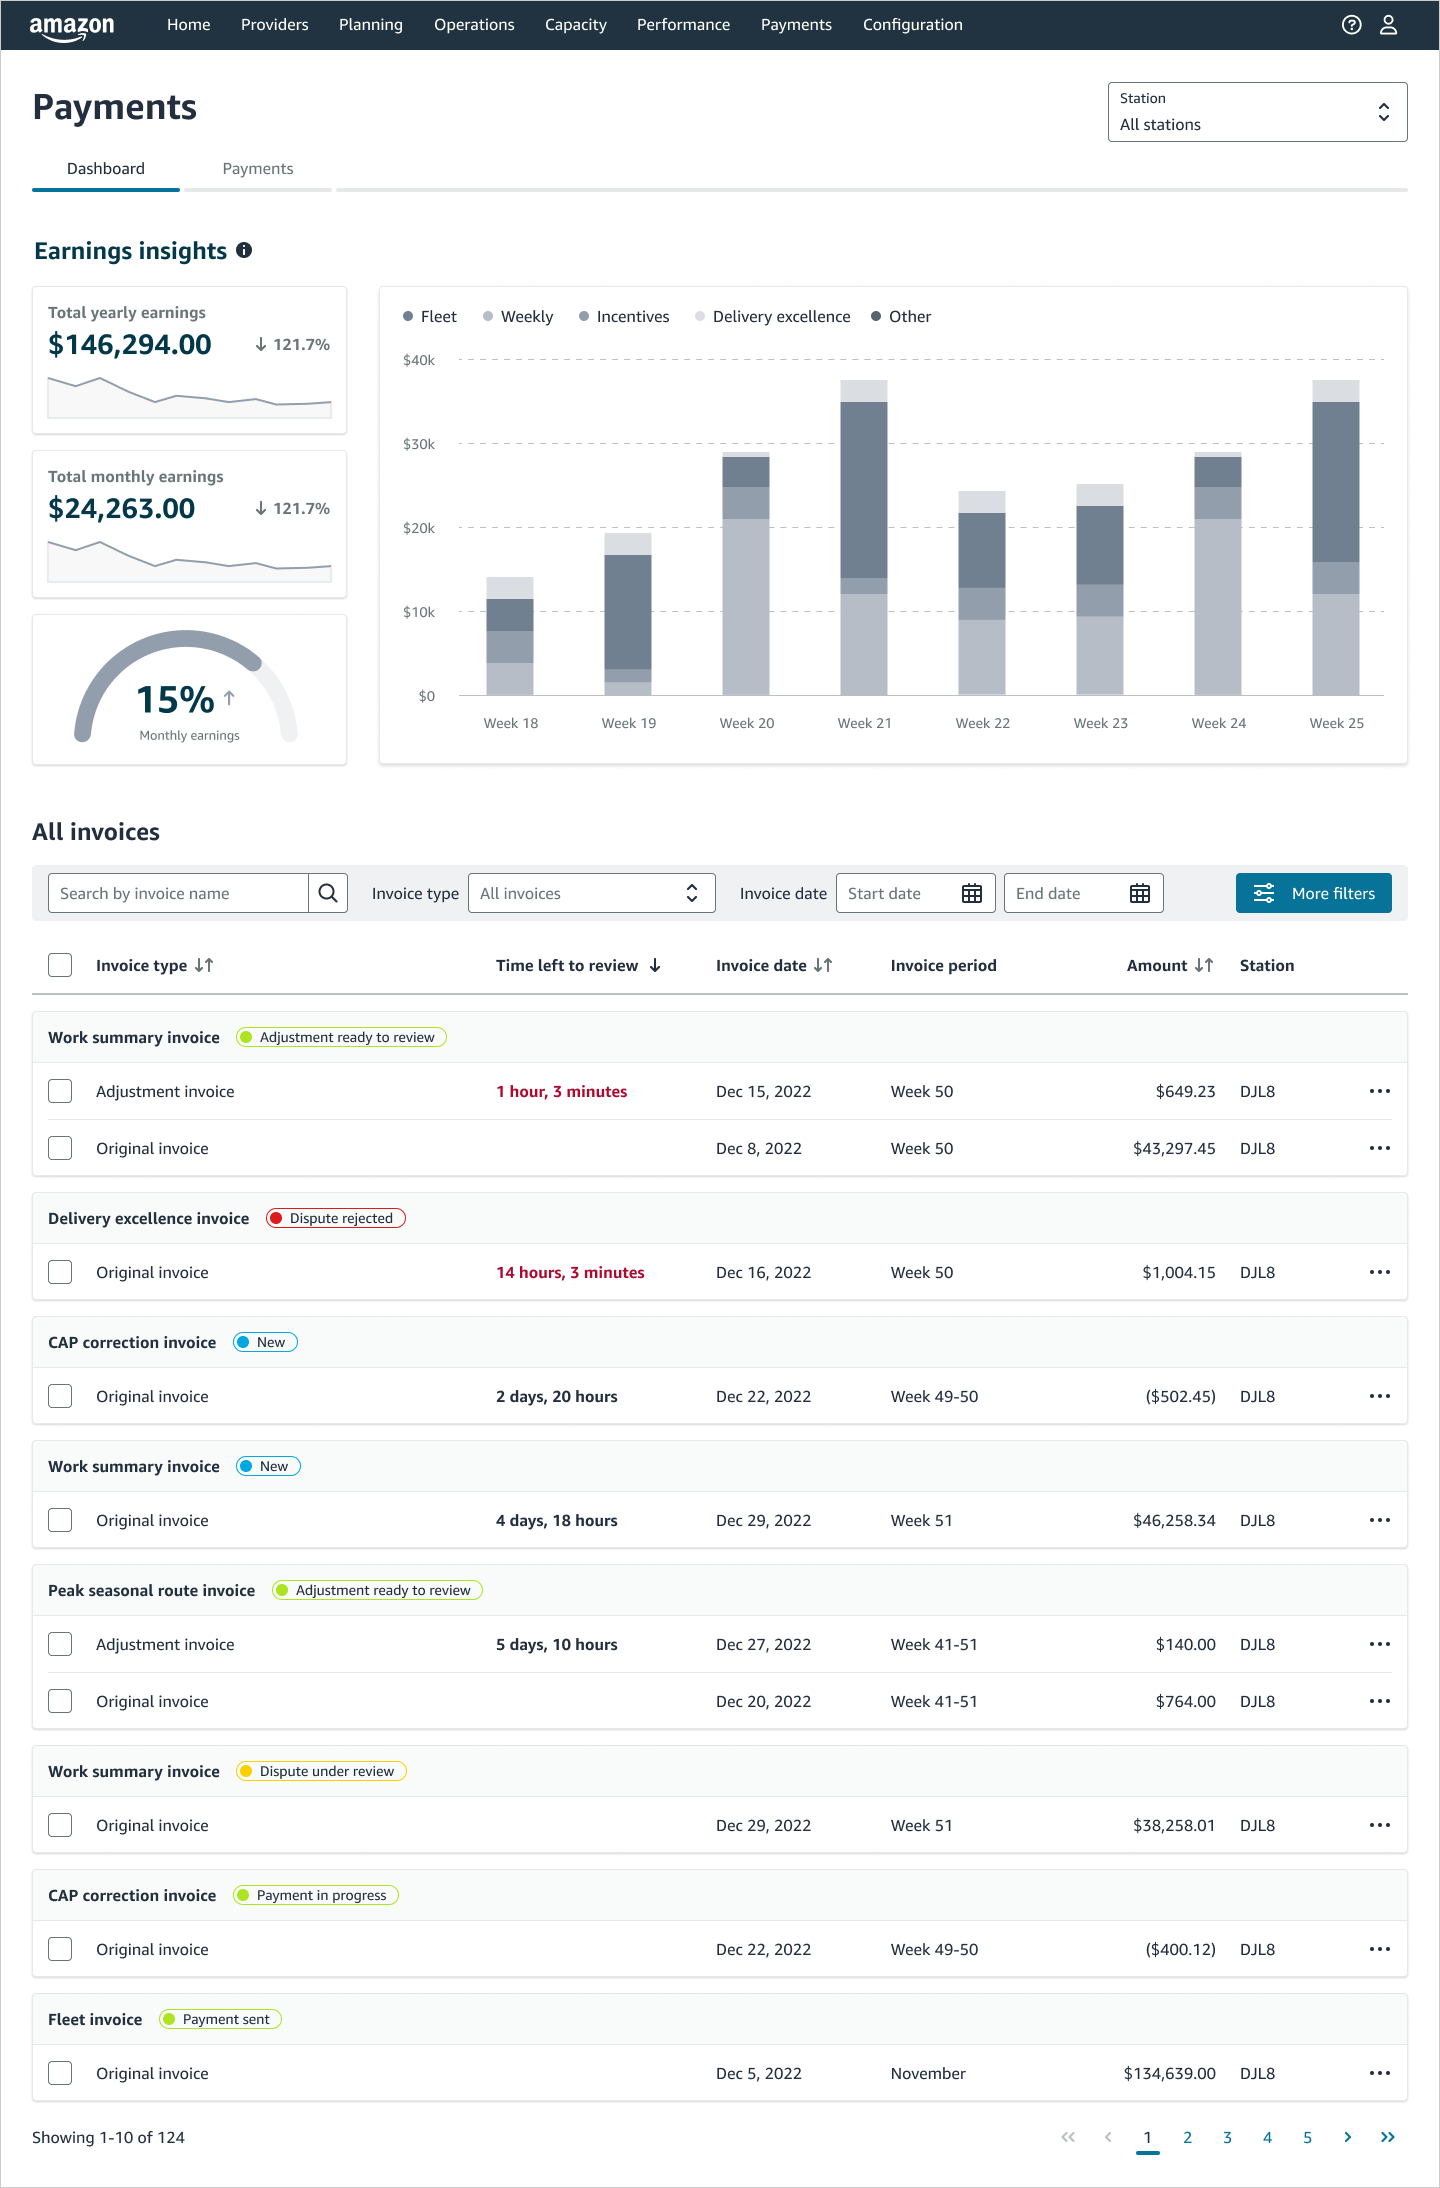
DSP Payment Dashboard Visions
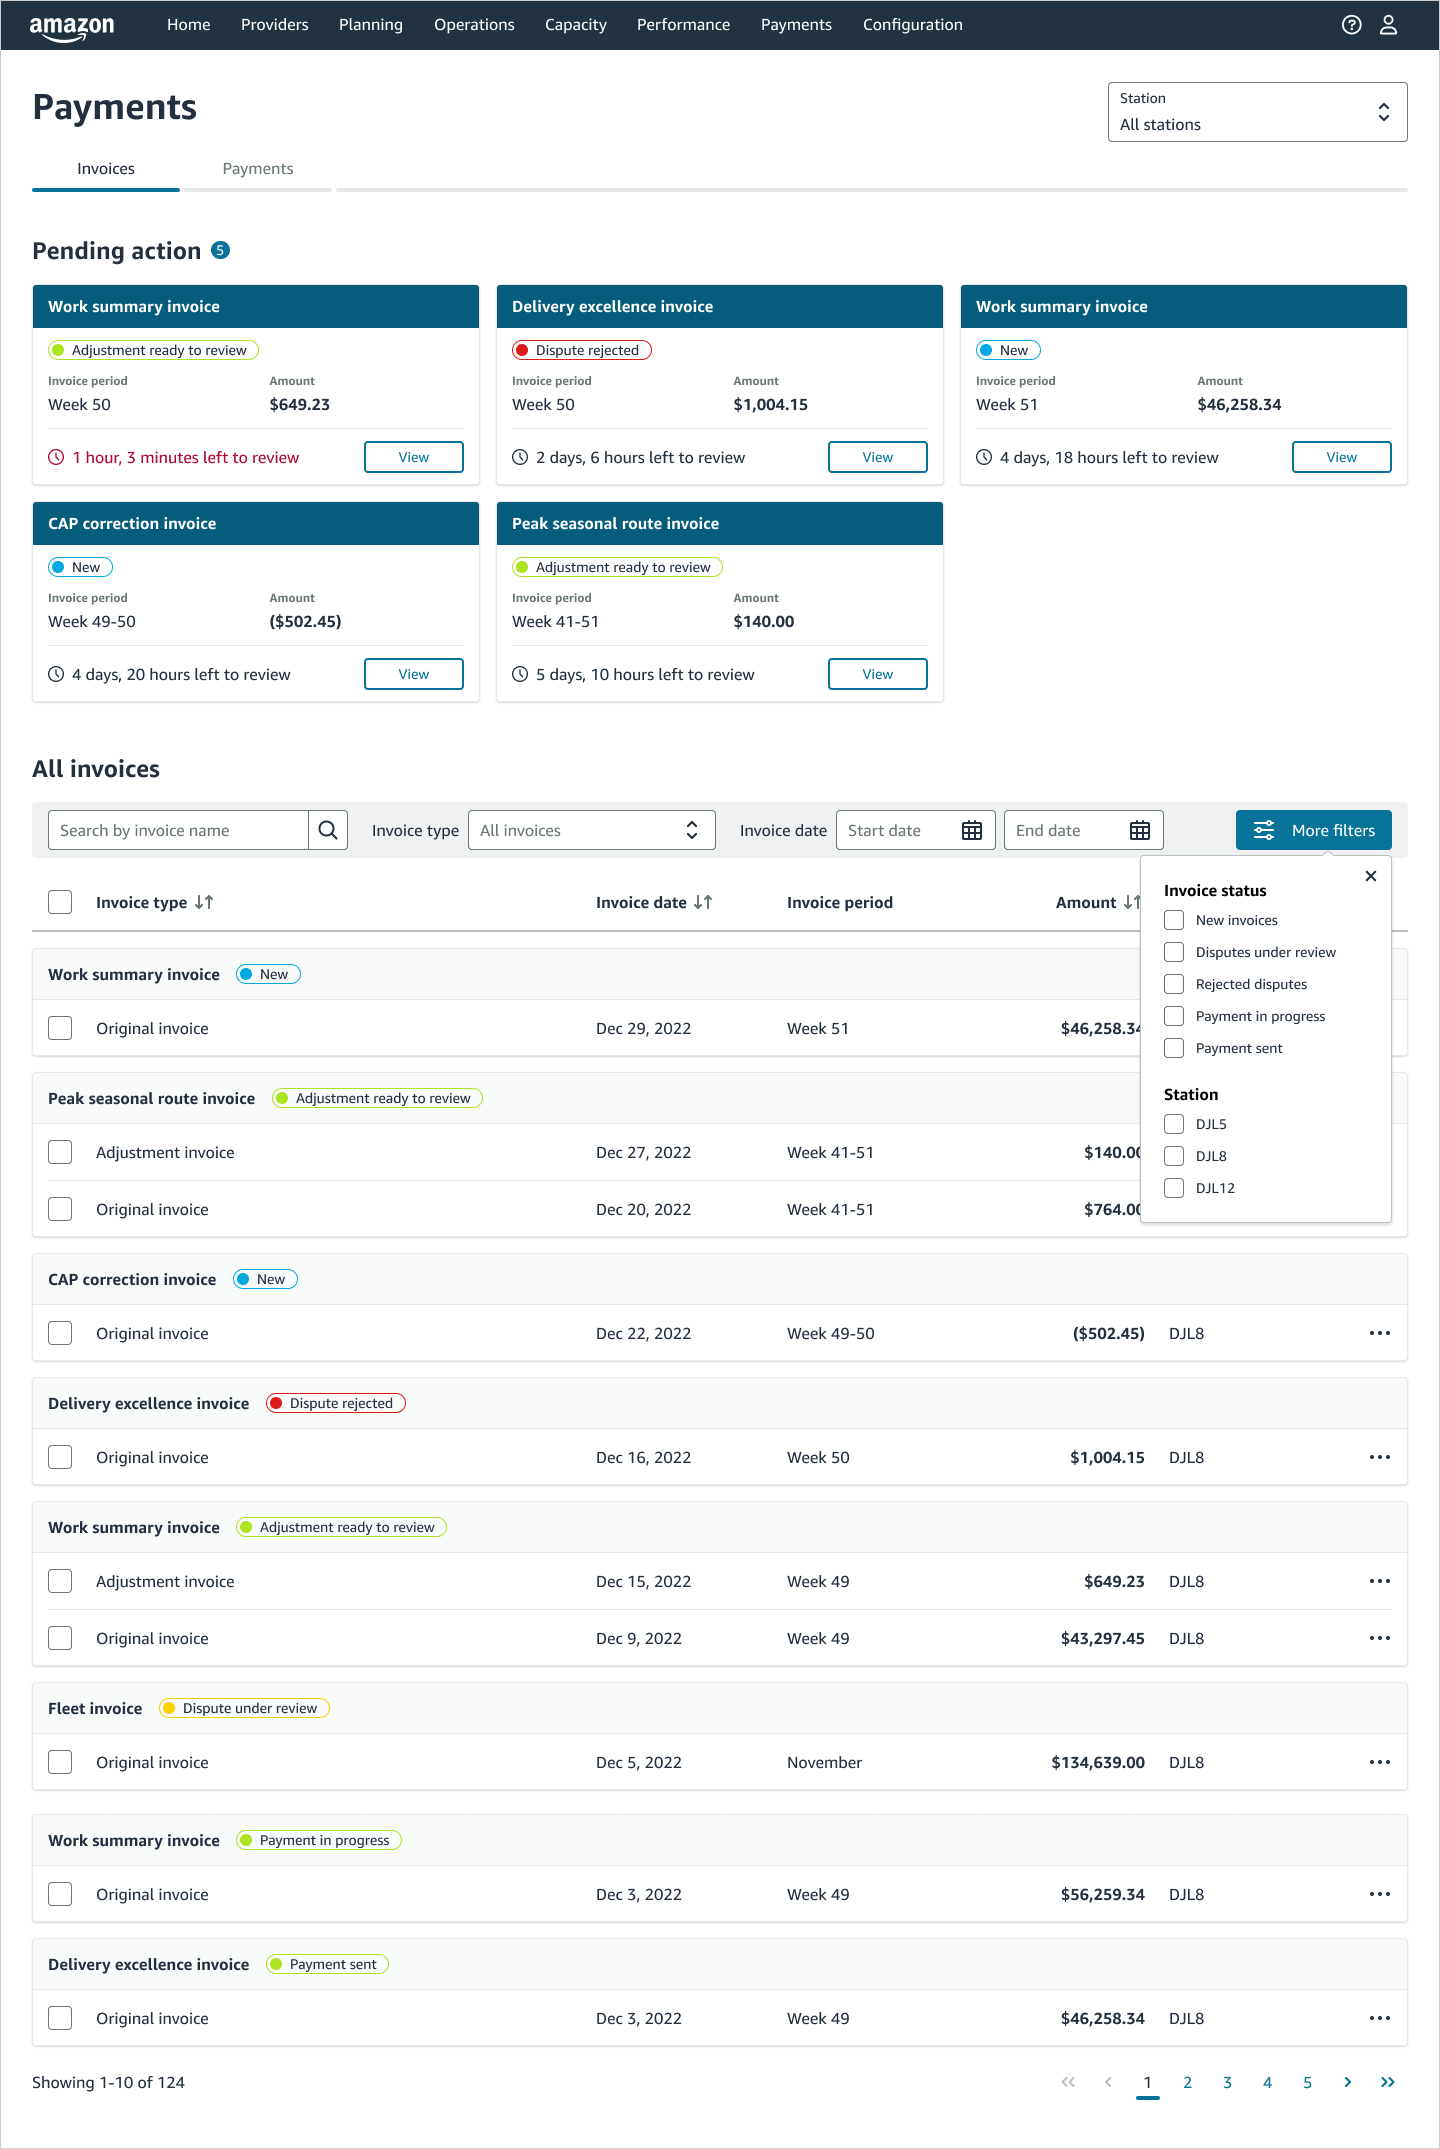
DSP Payment Dashboard at launch
Outcomes
Overhauled the B2B Payments Experience: Successfully rolled out the new Payments Portal network-wide to all US DSPs, consolidating all invoices and payment schedules into a single source of truth.
Dramatically Slashed Cognitive Load & Interaction Cost:
- Achieved a 71% reduction in median session dwell time (dropping from 7.4 minutes down to 2.1 minutes), saving valuable hours of administrative work for harried small business owners.
- Achieved a 90% reduction in the time it takes to select and download an invoice (slashed from 30–40 seconds down to 3–4 seconds).
- Achieved a 94% reduction in the time required to complete basic invoice search and collect tasks (from 2–3 minutes down to under 10 seconds).
Positive Adoption and Sentiment: The mobile-first design was highly praised by partners, with owners stating that the responsive layout “saved a lot of headaches” and that the clear categorization made bookkeeping “so much easier.”